⁹⁹ᵐTc-MIBI Scan Classification in Patients with Parathyroid Adenoma Using Machine Learning
Parathyroid glands are endocrine glands whose primary role is regulation of extracellular calcium and phosphorus levels. There are typically four of them, located in the neck, adhering to the posterior surface of the upper and lower poles of the thyroid gland, but there may be more and they can be found in various ectopic locations.1,2
The most common disorder affecting the parathyroid glands is primary hyperparathyroidism (PHPT). The cause of this disorder is autonomous synthesis and release of parathyroid hormone from one or more parathyroid glands. The most common cause of excessive synthesis is the presence of a metabolically active solitary adenoma (80% of cases), while multiglandular disorders are less common (15–20%), and malignant parathyroid tumours are the least frequent (<1%).3–5 Patients with primary hyperparathyroidism are often asymptomatic,6 but as the disease progresses, significant bone resorption can occur, leading to osteoporosis and pathological fractures, as well as accumulation of calcium salts in renal tissue. Even before any symptoms appear, reduced bone mineral density can be detected, and surgical treatment is recommended for the majority of PHPT patients.7–9
The only method of definitive cure for hyperparathyroidism is parathyroidectomy. Before surgery, it is necessary to visualize the parathyroid glands. Imaging methods are used for localising the parathyroid glands and determining the number of glands affected by the pathological process. Preoperative localization is very important due to the great variability in the anatomical position of the parathyroid glands, and the number of affected glands determines which surgical technique will be used — minimally invasive parathyroidectomy or bilateral exploration.10 Visualization of normal parathyroid glands is nearly impossible, because due to their small dimensions and low mass they cannot be distinguished from thyroid parenchyma. However, pathologically altered parathyroid glands can be visualized by various methods.11 It has been shown that the best option for preoperative evaluation of the parathyroid glands is ultrasonography followed by dual-phase scintigraphy with technetium-99m-methoxyisobutylisonitrile (99mTc-MIBI) or computed tomography.12 In this paper, we focused on the processing and analysis of 99mTc-MIBI scans using machine learning methods.
99mTc-MIBI is a radiopharmaceutical that, due to its lipophilic nature, enters cells by diffusion and then accumulates in mitochondria. As tissue metabolic activity increases, so does the accumulation. Following intravenous administration, this radiopharmaceutical accumulates in both thyroid and parathyroid tissue. However, clearance from the thyroid gland is faster than from pathologically altered parathyroid glands, so after "washout" of the radiopharmaceutical from the thyroid, the parathyroid glands can be observed on the scans. This difference in clearance allows parathyroid scintigraphy to be performed by administering only one radiopharmaceutical and imaging in two phases — early and delayed. In the early phase, the thyroid gland is visualised, while in the delayed phase only pathologically altered parathyroid glands or pathological process on the thyroid are shown, if any are present.11 The early scan is acquired 10–15 minutes after radiopharmaceutical administration, and the delayed one after 90–150 minutes.
Scans are interpreted visually by one or more nuclear medicine specialists. In healthy subjects, the early scan normally shows the thyroid gland, while in the delayed scan neither the thyroid nor the parathyroid glands are visualised. By contrast, pathologically altered parathyroid glands are visualised as one or more foci of radiopharmaceutical accumulation, which is usually already visible on the early scan and persists on the delayed one. The final finding is issued on the basis of the delayed phase.13 The finding of a nuclear medicine specialist contains information on whether the parathyroid glands are visualised, as well as their number and localisation. This method carries a certain degree of subjectivity; even among experienced nuclear medicine specialists there is a certain level of disagreement in issuing final findings.14 Furthermore, the correlation between scintigraphic findings and the pathological findings established after surgery is not sufficiently high for some causes of hyperparathyroidism. For multiglandular disorders, the concordance between the specialist's findings and the true pathological finding is slightly above 60%, largely because it is not always possible to correctly localise all affected glands by visual means.15
The aim of this work is to achieve objective interpretation of 99mTc-MIBI scans using machine learning methods. We decided to address this topic in order to reduce the subjectivity inherent in the visual interpretation of scans. Objectivity in interpretation was achieved by measuring the values of certain quantitative image characteristics from the scans using the ImageJ image processing software,16 and then training a machine learning method to classify scans as positive or negative on the basis of these data. An additional aim of our work is the education of junior physicians in nuclear medicine residency, for whom our trained machine learning model can help distinguish positive from negative findings at the beginning of their careers.
This is a retrospective study that included 188 patients, i.e. 188 delayed phase scans of dual phase parathyroid scintigraphy with 99mTc-MIBI. All imaging was performed at the Centre for Nuclear Medicine, Clinical Centre Niš, between 2016 and 2021. 99mTc-MIBI activity of 500–700 MBq was administered intravenously, and after 10 minutes the first — "early" — scintigraphy was acquired. The patient's position was supine with arms alongside the body, and the neck and upper chest region were imaged in the anterior projection. A gamma camera with a parallel-hole collimator was used for imaging. After 120 minutes from 99mTc-MIBI administration, the second — "delayed" — scintigraphy was acquired with the same imaging parameters.
113 of these scintigraphies were positive. They contained a total of 130 pathological findings, each of which was analysed separately. In other words, if more than one adenoma was present on an image, the parameters for each adenoma were measured separately and each was included in the analysis. 75 scintigraphies were negative, and from these we also created 130 instances. This was done by measuring parameters in the regions where the parathyroid glands were expected to be found, even though they were not visualised. In other words, on each of the 75 scans, measurements were performed in the regions of both upper or lower poles of the thyroid gland, the faint outline of which remains visible on the delayed scan. We did not include any scintigraphies in which, due to the presence of thyroid pathology, it was not possible to determine whether parathyroid pathology was also present (indeterminate findings). Of the 188 patients, 26 were male and 162 female (Table 1).
Table 1. Overview of patient characteristics included in the study
| Delayed phase scan | Positive | Negative | Total |
|---|---|---|---|
| Male | 19 | 7 | 26 |
| Female | 94 | 68 | 162 |
| Total | 113 | 75 | 188 |
The idea behind our approach was as follows: (i) find parameters (attributes) by which the presence or absence of pathologically altered parathyroid tissue on a scan can be expressed quantitatively; (ii) define their mutual relationships; and (iii) express these relationships in such a way that it is clear from them whether the appearance of a pathologically altered parathyroid gland is present on the scan or not. We chose to identify these parameters using the ImageJ image processing software, and to determine their relationships using machine learning methods, employing the Weka platform.17
We began the study by processing images in ImageJ. We set out to determine in advance which parameters might be usable for distinguishing pathological from negative findings. We settled on several of them: arithmetic mean of pixel intensity (Mean), standard deviation of pixel intensity (SD), minimum and maximum pixel intensity values (Min and Max), and median pixel intensity (Median) — for the whole image, for the image cropped below the salivary glands, and for each small image region containing the pathologically altered parathyroid gland, or the region where we expect the parathyroid glands to be located if the finding is negative. There were 15 parameters in total.
In black-and-white images such as scintigraphies, pixel intensity is a value that reflects how dark or bright the pixels are; it ranges from 0 to 255, so that the darkest (black) pixels have a value of 0 and the brightest (white) pixels have a value of 255. The parameter Mean — the arithmetic mean of pixel intensity — is obtained by summing all intensity values in one area and dividing by the number of pixels in that area. Given that an adenoma appears as a dark focus of radiopharmaceutical accumulation, we expected all the stated values to be relatively lower if an adenoma is present.
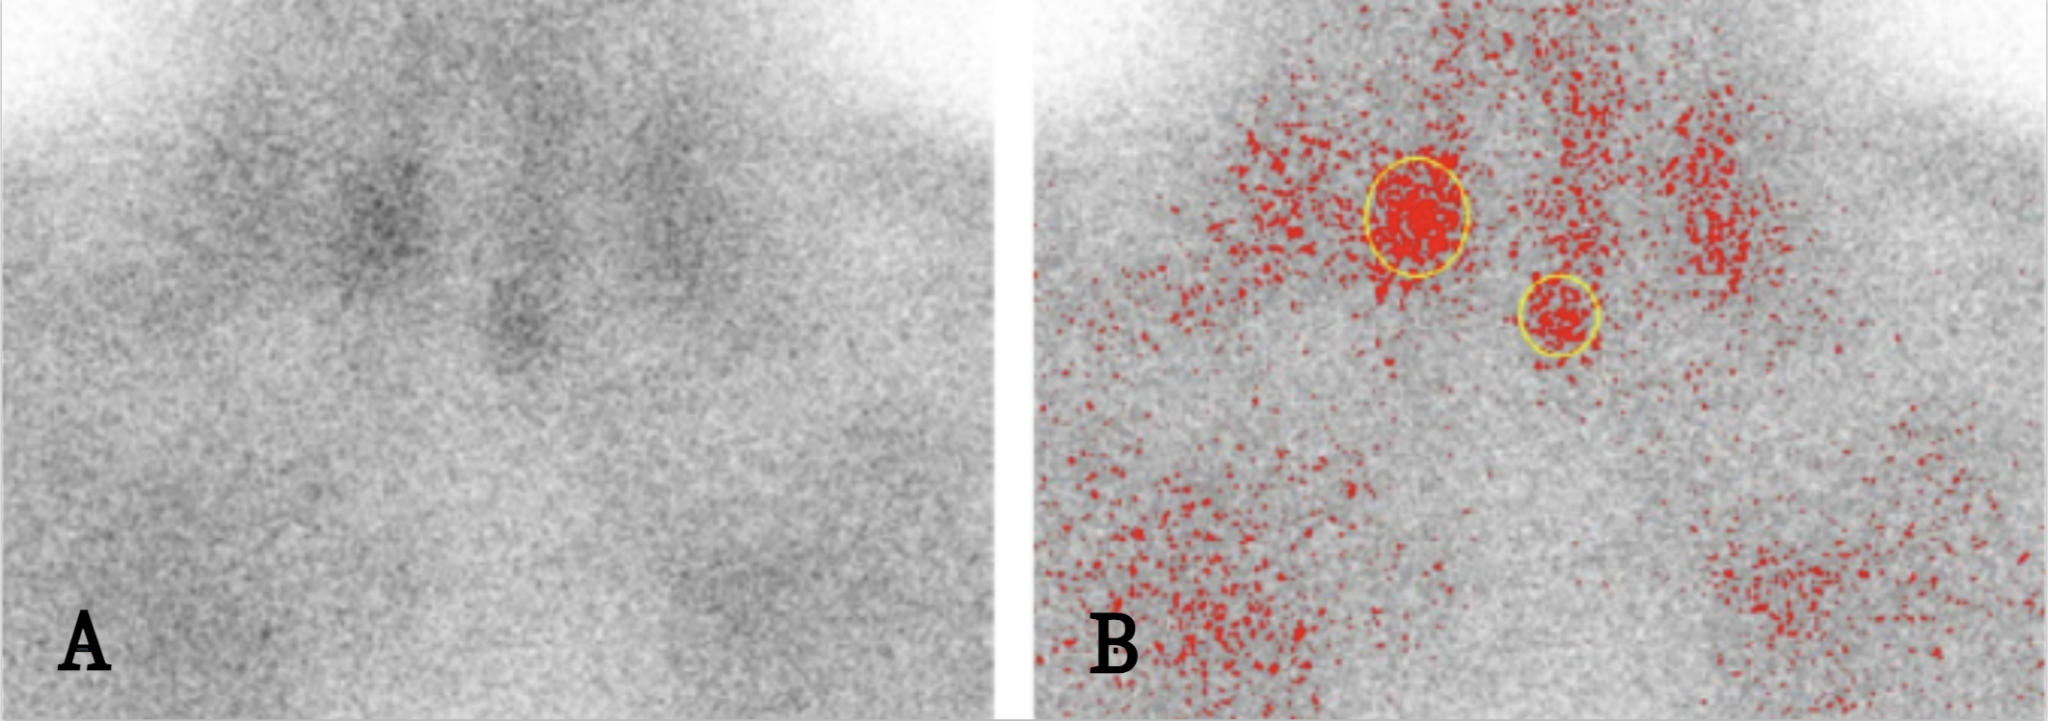
We measured these parameters first on the whole image using the Measure option. We then cropped the original images below the salivary glands using the Crop Image option and measured the parameters for the resulting image (Figure 1A). Cropping of the salivary glands was performed because we expected the standard deviation of pixel intensity to be one of the significant parameters for determining whether an adenoma is present (pixel intensity will vary more in an image where an adenoma is present than in one where it is not). However, the salivary glands also appear as dark foci because they accumulate 99mTc-MIBI, so we excluded them in order not to influence the standard deviation. In addition, there is great variability in radiopharmaceutical accumulation in the salivary glands among patients, and we did not want this variability to affect the final result. To ensure that we had not discarded any important data by the cropping, we nevertheless measured all parameters before cropping (on the whole image), so that the original image could also influence the final conclusion of the algorithm.
The next step was measuring values in a specific limited region of the image. To better visualise the regions we wanted to measure, we used the Threshold option, which visually marks in red the pixels with an intensity greater or lower than a value specified by the user (we selected values corresponding to darker pixels). We marked the region of interest using the ellipse-shaped Selection option — the ellipse shape was chosen because it best corresponds to the planar representation of adenomas and parathyroid glands. Values for each adenoma were measured separately, even if there were more than one on the image (Figure 1B). The aim was to enable a future user to examine whether any individual parathyroid gland is affected by the pathological process — i.e. to improve the ability to localise pathologically altered glands.
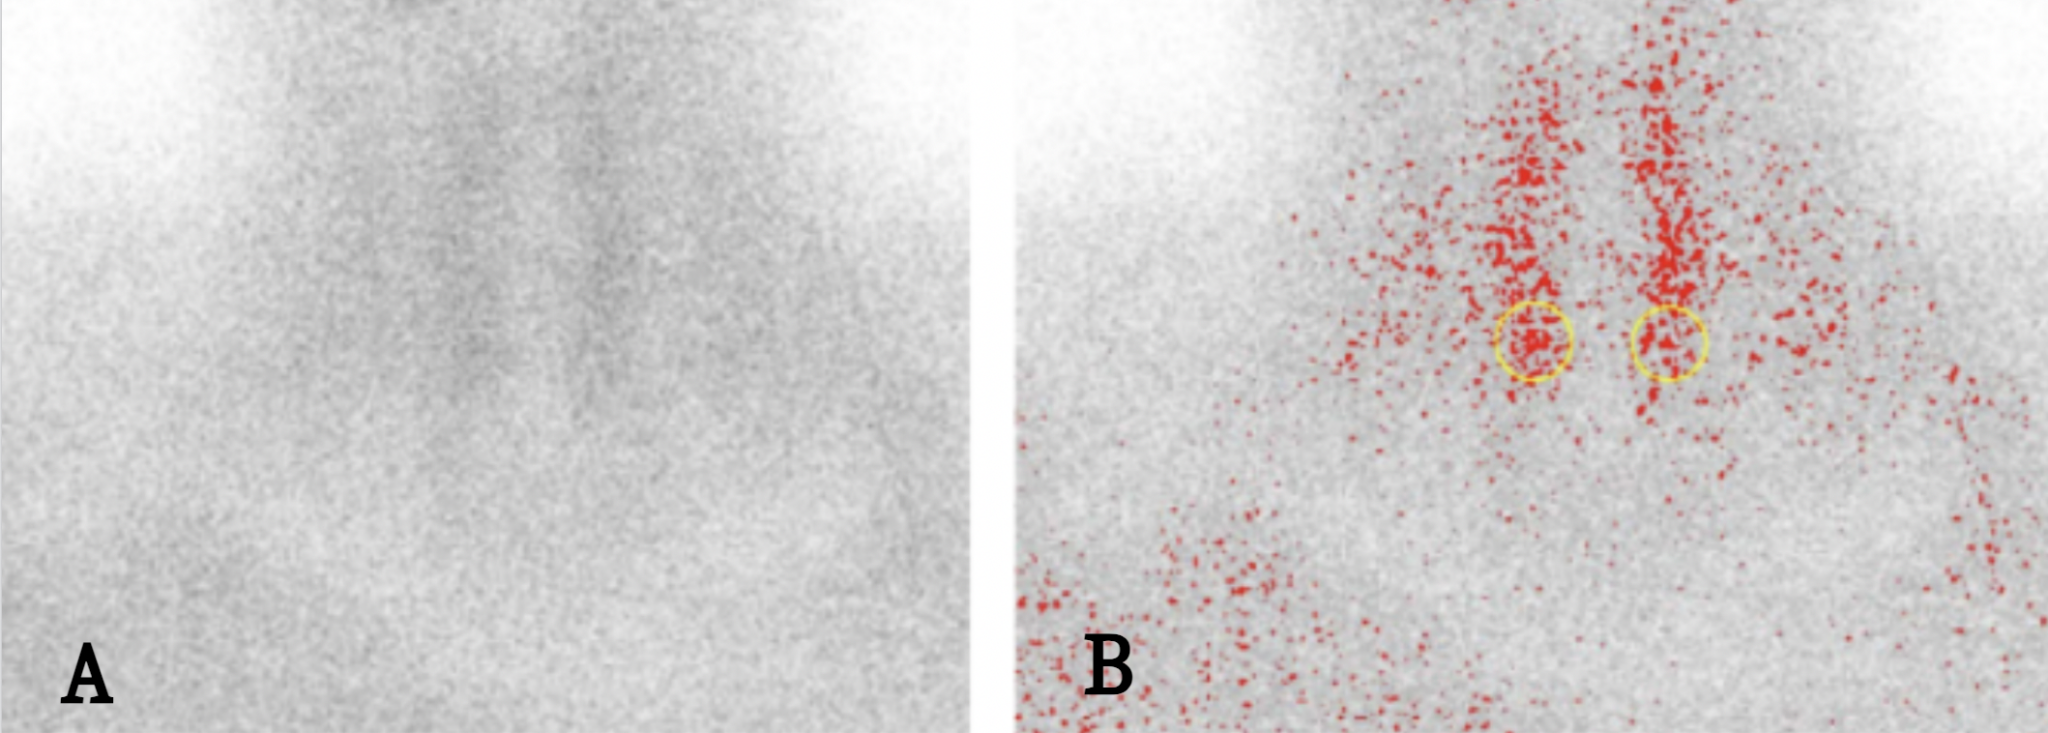
As for negative findings, measurements were performed in regions corresponding to the location of the parathyroid glands. Given the smaller number of negative findings, in most of them measurements were performed on a total of two poles of the thyroid gland (regions where the parathyroid glands are expected to be found), in order to increase the number of data points originating from negative findings (Figure 2).
We thus obtained a dataset in which 130 instances originated from 113 images with positive findings and 130 from 75 images with negative findings. The values of these attributes were normalised before being passed to the algorithms for further analysis. We also added a Class attribute with two possible values: positive and negative. We divided the data into a training/validation set and a test set, in a 75:25 ratio.
We used the following classification algorithms: Logistic Regression (LR), k-nearest neighbours (kNN), and Random Forest (RF). For LR we used L2 regularisation, testing regularisation constant values from 0.1 to 10⁻⁹. For kNN, we tested k values of 1, 3, 5, 7, and 9. For RF we tested number of trees values of 100, 150, and 200. For training, validation, and selection of the optimal algorithm, we used cross-validation, after which we measured performance on an independent test dataset that had not been used during algorithm selection, in order to obtain a more accurate estimate of performance.18
By evaluating three different algorithms — Logistic Regression, k-nearest neighbours, and Random Forest — we obtained results showing that it is possible to recognise adenomas on scintigraphy images using machine learning algorithms with an accuracy of approximately 90%. Of these three algorithms, LR and RF had the best performance (89.23% and 90.79%), while the kNN algorithm reached an accuracy of 87.69%. These values were achieved by LR with a regularisation constant of 0.001, RF with 100 trees, and kNN with k = 9. The accuracy of these algorithms did not change even when we removed all attributes derived from the whole image before cropping of the salivary glands.
All trained algorithms had somewhat lower sensitivity than precision (Table 2). Sensitivity (or recall) describes the algorithm's ability to identify as many patients with adenoma as possible among patients who truly have adenoma — higher sensitivity means no one with adenoma will be overlooked. Precision is the ratio of the number of patients the algorithm identified as having adenoma to the number of patients who truly have adenoma — higher precision means fewer patients are wrongly identified as positive. Sensitivity was highest for the Random Forest algorithm, and precision for Logistic Regression. Specificity reflects the algorithm's ability to correctly identify patients with negative findings; kNN and LR had slightly higher specificity than RF.
Table 2. Precision, sensitivity and specificity of algorithms on the test dataset
| Algorithm | Precision | Sensitivity | Specificity |
|---|---|---|---|
| Random Forest | 0.897 | 0.897 | 0.917 |
| k-nearest neighbors | 0.957 | 0.759 | 0.972 |
| Logistic Regression | 0.958 | 0.793 | 0.972 |
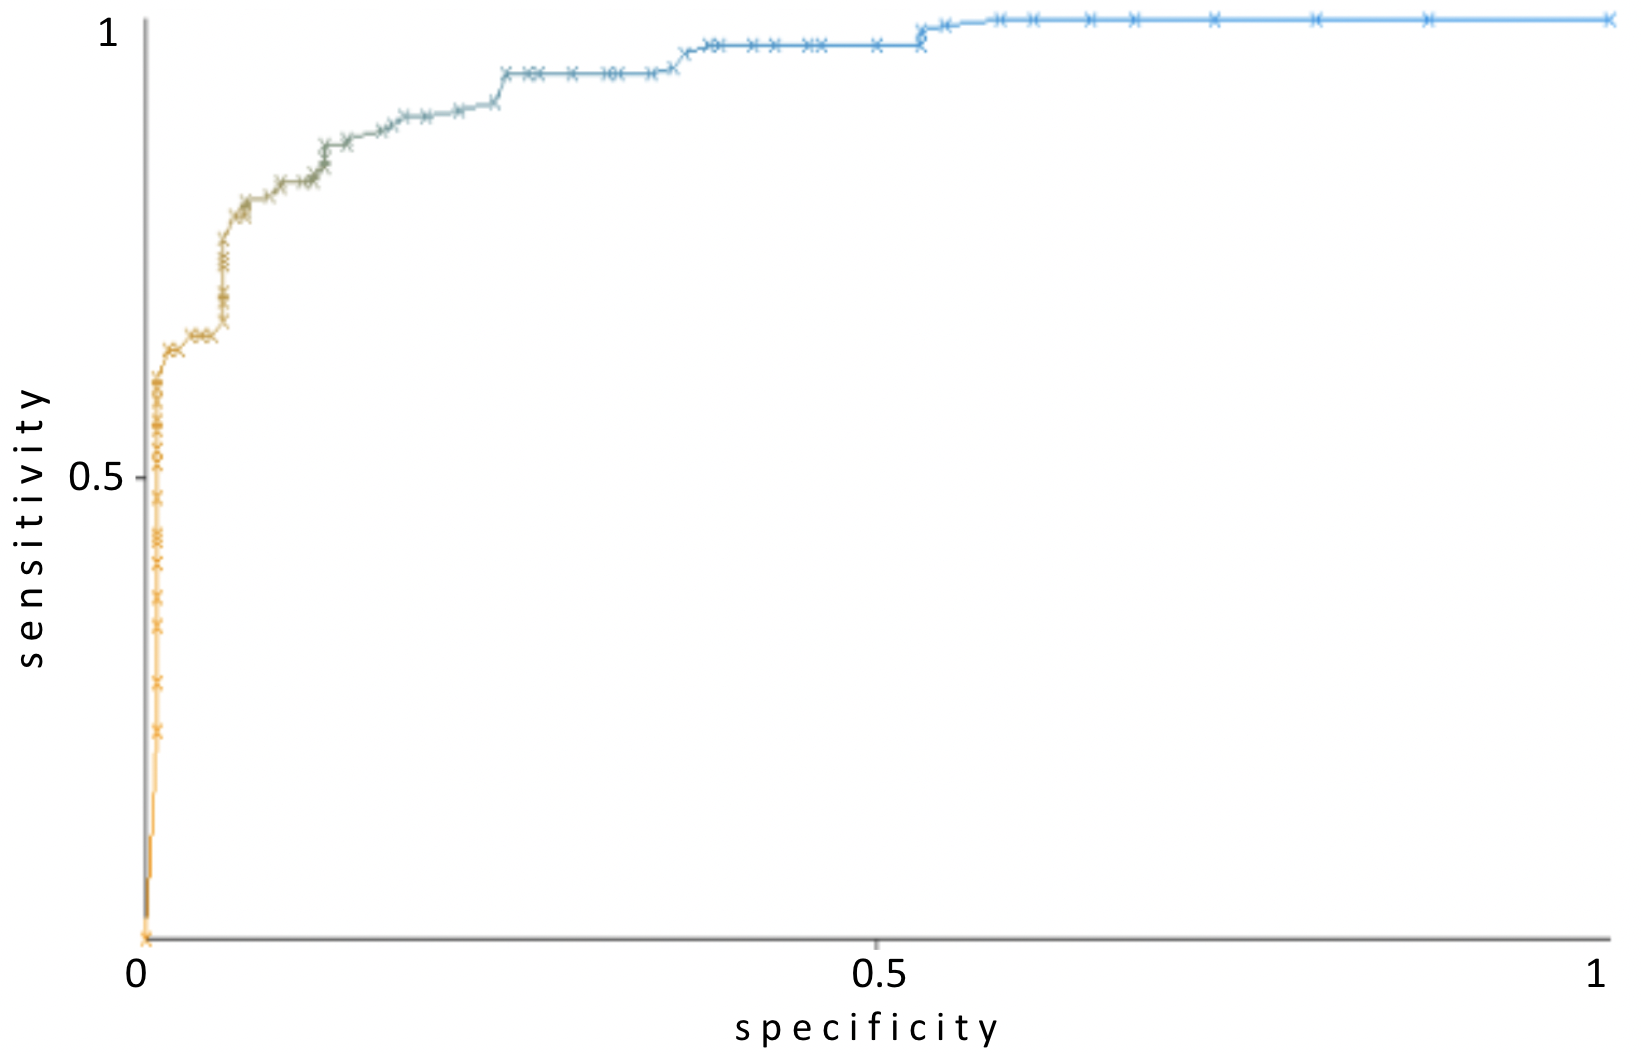
Machine learning algorithms for classification are most often able to predict, in addition to class membership, also the probability of class membership — to quantify how reliably the class has been predicted for a given instance. By using these probabilities for different thresholds between the two classes, it is possible to display algorithm performance using ROC curves. The area under the ROC curve (AUROC) ranges from 0.5 (worst) to 1 (best). Comparing the AUROC for the three algorithms (Table 3), Random Forest performed best and is therefore the most significant for the purposes of our study.
Table 3. Area under the ROC curve for the algorithms used
| Algorithm | AUROC |
|---|---|
| Random Forest | 0.940 |
| k-nearest neighbors | 0.896 |
| Logistic Regression | 0.899 |
Machine learning encompasses a wide spectrum of methods used for drawing various conclusions from data. We used a form of machine learning called supervised learning. The outcome of supervised learning is the formation of a model that, on the basis of given data (attributes) relating to some phenomenon, will be able to draw a certain conclusion about it.19 In our case, on the basis of various quantitative data obtained from scintigraphy images, our model determines whether a parathyroid adenoma is present on a given image or not. This machine learning method is called classification. In classification, datasets are used in which each instance (each individual case) is labelled in advance with membership of some group (class), and on the basis of these data, the class of each new individual case must subsequently be predicted. We then applied machine learning classification algorithms to this labelled dataset — these algorithms find patterns by which all attributes are connected to the class. A model trained in this way can then be applied to new datasets in order to assign each new instance to a particular class.
All algorithms we used achieved accuracy of about 90%, and among them there was no statistically significant difference in this result. However, sensitivity was highest for the Random Forest algorithm. This is a significant finding for us given the nature of the subject we are dealing with. Specifically, sensitivity is a measure that tells us in what percentage of cases the algorithm will recognise an adenoma when it is truly present. This is important because persons with a clearly positive finding of one adenoma on scintigraphy undergo minimally invasive parathyroidectomy, while for persons with a negative scintigraphic finding, bilateral exploration is used. Minimally invasive parathyroidectomy refers to surgical methods aimed at reducing the size and depth of the incision and accelerating recovery. Bilateral exploration is a more complex method, in which all parathyroid glands are identified and compared with one another during the operation.10 Because minimally invasive parathyroidectomy is a procedure that patients tolerate better, it is important that the algorithm correctly identifies all patients who are candidates for this operation — i.e. that the algorithm has the highest possible sensitivity.
This holds regardless of the fact that Random Forest had somewhat lower specificity than the others. Lower specificity means there are more false positive findings — a greater number of patients would be candidates for minimally invasive parathyroidectomy even though they objectively are not. However, if minimally invasive parathyroidectomy cannot be performed in the operating theatre, it is possible to immediately switch to bilateral exploration and successfully complete the operation.
In a study examining variability in interpretation of parathyroid scintigraphies with 99mTc-MIBI,14 concordance between findings issued by different nuclear medicine specialists was approximately 90% (in the range of 85% to 95%). Of particular importance is the finding that concordance between two findings issued by the same specialist at different time points was also always around 90%. This reflects the incomplete certainty a specialist has when interpreting a finding. Scans can occasionally be difficult to interpret, and in practice several physicians may jointly interpret a problematic scan. In this situation, the practical value of our algorithm is as follows: it is possible for the algorithm to replace one of the aforementioned physicians, which saves that physician's time and allows them to attend to other duties. This is possible because our algorithm's accuracy is not significantly lower than that of a specialist. In addition, our work can assist in the training of physicians in residency who do not yet have sufficient experience to issue findings independently.
Limitations of our work are the relatively small number of instances used for model training and the requirement that data be prepared in the image processing software before being passed to the algorithm. In the future we plan to collect a larger number of scans, which would further improve algorithm accuracy. A large number of data would also enable the use of deep neural networks, a form of machine learning that yields the best performance and in image interpretation can equal or surpass that of humans.20,21 However, to achieve such results, a very large number of instances is necessary — in one comparable study, analysis was performed on as many as 12,222 scans.20 The use of deep neural networks would also eliminate the image preparation step, because the input for such algorithms can be the whole image, rather than parameters measured beforehand.
In this paper we have shown that the application of machine learning for the classification of 99mTc-MIBI scans on the basis of previously measured quantitative image characteristics is feasible, with an accuracy of approximately 90%. The practical value of our algorithm is significant — it can be applied so as to replace an additional nuclear medicine specialist, to provide confidence in a specialist's finding, as well as for the training of junior physicians in residency. With a greater number of instances (scans), we believe the accuracy would be further improved, since algorithms trained on larger numbers of instances generally have better performance. It is also possible that performance would be further improved by adding new attributes — i.e. by identifying additional parameters that could change in accordance with whether the finding is positive or negative. Moreover, with a larger number of instances it is possible to explore the performance of other algorithms as well, among which deep neural networks are of particular significance, as they require a large number of instances.
- Hall JE, Hall ME. Guyton and Hall Textbook of Medical Physiology E-Book. Elsevier Health Sciences; 2020.
- Policeni BA, Smoker WRK, Reede DL. Anatomy and Embryology of the Thyroid and Parathyroid Glands. Semin Ultrasound CT MRI. 2012;33(2):104–14.
- Walker MD, Silverberg SJ. Primary hyperparathyroidism. Nat Rev Endocrinol. 2018;14(2):115–25.
- Erickson LA, Mete O, Juhlin CC, Perren A, Gill AJ. Overview of 2022 WHO Classification of Parathyroid Tumors. Endocr Pathol. 2022.
- Thompson NW, Eckhauser FE, Harness JK. The anatomy of primary hyperparathyroidism. Surgery. 1982;92(5):814–21.
- Lowe H, McMahon DJ, Rubin MR, Bilezikian JP, Silverberg SJ. Normocalcemic Primary Hyperparathyroidism: Further Characterization of a New Clinical Phenotype. J Clin Endocrinol Metab. 2007;92(8):3001–5.
- Chandran M, Wong J. Secondary and Tertiary Hyperparathyroidism in Chronic Kidney Disease: An Endocrine and Renal Perspective. Indian J Endocrinol Metab. 2019;23(4):391–9.
- Bilezikian JP, Cusano NE, Khan AA, Liu J-M, Marcocci C, Bandeira F. Primary hyperparathyroidism. Nat Rev Dis Primer. 2016;2:16033.
- Zhao L, Liu J, He X-Y, et al. The Changing Clinical Patterns of Primary Hyperparathyroidism in Chinese Patients: Data from 2000 to 2010 in a Single Clinical Center. J Clin Endocrinol Metab. 2013;98(2):721–8.
- Wilhelm SM, Wang TS, Ruan DT, et al. The American Association of Endocrine Surgeons Guidelines for Definitive Management of Primary Hyperparathyroidism. JAMA Surg. 2016;151(10):959–68.
- Volterrani D, Erba PA, Carrió I, Strauss HW, Mariani G, editors. Nuclear Medicine Textbook: Methodology and Clinical Applications. 1st ed. Springer; 2019.
- Solorzano CC, Carneiro-Pla D. Minimizing Cost and Maximizing Success in the Preoperative Localization Strategy for Primary Hyperparathyroidism. Surg Clin North Am. 2014;94(3):587–605.
- Petranović Ovčariček P, Giovanella L, Carrió Gasset I, et al. The EANM practice guidelines for parathyroid imaging. Eur J Nucl Med Mol Imaging. 2021;48(9):2801–22.
- Dalar C, Ozdogan O, Durak MG, et al. Interobserver And Intraobserver Agreement In Parathyroid Scintigraphy: How Can Parathyroid Scintigraphy Be Made More Reliable? Endocr Pract. 2012;18(4):538–48.
- Bahador M, Latifi H, Grossman S, et al. Optimal interpretative strategy for preoperative parathyroid scintigraphy in the setting of multigland disease. J Nucl Med. 2011;52(S1):558.
- Schneider CA, Rasband WS, Eliceiri KW. NIH Image to ImageJ: 25 years of image analysis. Nat Methods. 2012;9(7):671–5.
- The WEKA Workbench. Online Appendix for "Data Mining: Practical Machine Learning Tools and Techniques."
- Raschka S. Model Evaluation, Model Selection, and Algorithm Selection in Machine Learning. ArXiv:1811.12808. 2020.
- Wainberg M, Merico D, Delong A, Frey BJ. Deep learning in biomedicine. Nat Biotechnol. 2018;36(9):829–38.
- Zhao Z, Pi Y, Jiang L, et al. Deep neural network based artificial intelligence assisted diagnosis of bone scintigraphy for cancer bone metastasis. Sci Rep. 2020;10(1):17046.
- Qiao T, Liu S, Cui Z, et al. Deep learning for intelligent diagnosis in thyroid scintigraphy. J Int Med Res. 2021;49(1):0300060520982842.